Brief
Take three or four exposures of the same scene. Don’t change anything on the camera and keep the framing the same.
Preview the shots on the LCD screen. At first glance they look the same, but are they? Perhaps a leaf moved with the wind, the light changed subtly or the framing changed almost imperceptibly to include one seemingly insignificant object and exclude another. Time flows, the moment of each frame is different and, as the saying goes, ‘you can’t step into the same river twice’.
Now bring up the histogram on the preview screen. The histogram is a graphical representation of the exposure – the camera’s sensitivity to light. As you page through the images you can see small variations in the histograms. Even though the pictures look the same, the histogram data shows that in a matter of seconds, the world changes, and these subtle differences are recorded by the camera. If you refine the test conditions, shooting on a tripod to fix the framing, moving indoors and closing the curtains to exclude daylight, still the histogram changes. Probably, some fo the changes are within the camera itself, still, the camera is a sensitive enough instrument to record them.
How I approached this exercise
I fitted an 85mm f1.4 prime lens to the D4 and ventured out on a wet, windy day. I selected the prime to eliminate any risk of change in focal length that would be introduced by using a zoom. The camera was set to ISO800 and set to (P) Program. I started by thinking about what might change. If handheld, the frame would indeed be as steady as I can hold it, which in turn would be dependent on the weather conditions. The other obvious variable is time. My camera shutter release modes: Single, Continuous Low and Continuous High. The latter two set the camera to capture frames as a burst and the D4 is capable of 11 frames per second if required. For this exercise, I elected to start with Single and pause for a second or so.
First four frames
I ventured out into the wet and windy weather to shoot 4 frames, which can be seen below:
-

- Summerhouse 1
-

- Summerhouse 2
-

- Summerhouse 3
-

- Summerhouse 4
-

- Summerhouse Gif
The exposures were all recorded as 1/160th at f6.3. Not surprisingly, hand holding was never going to be easy in these conditions, but in order to highlight the change in framing and the movement within the frame, I created the animation below.
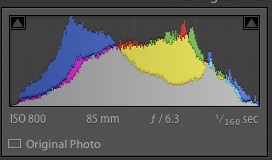
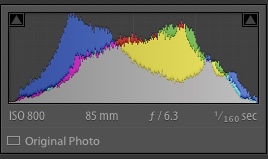
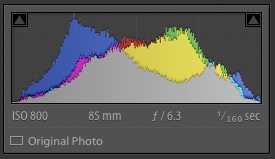
I was shocked at the variation between frames, with only approximately 1s between each shot. When added to the trees and branches moving in the strong winds, the changes in the histogram were significant also. The four histograms can be seen below:
-
- Summer 1 Histogram
-
- Summer 2 Histogram
-

- Summer 3 Histogram
-
- Summer 4 Histogram
-
- Summer GIF
How is the Histogram Changing?
In order to examine the changes in the histogram, I needed to understand how they work. I already knew that histograms are effectively maps of exposure, showing black to white along the x axis and spectral intensity in the y axis. The basic layout is shown in the diagram below [1]
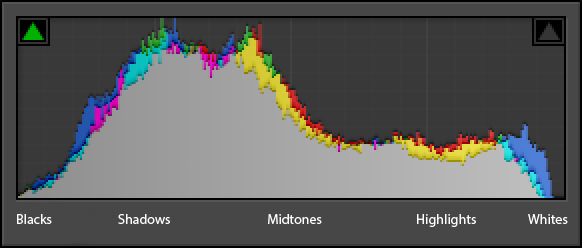
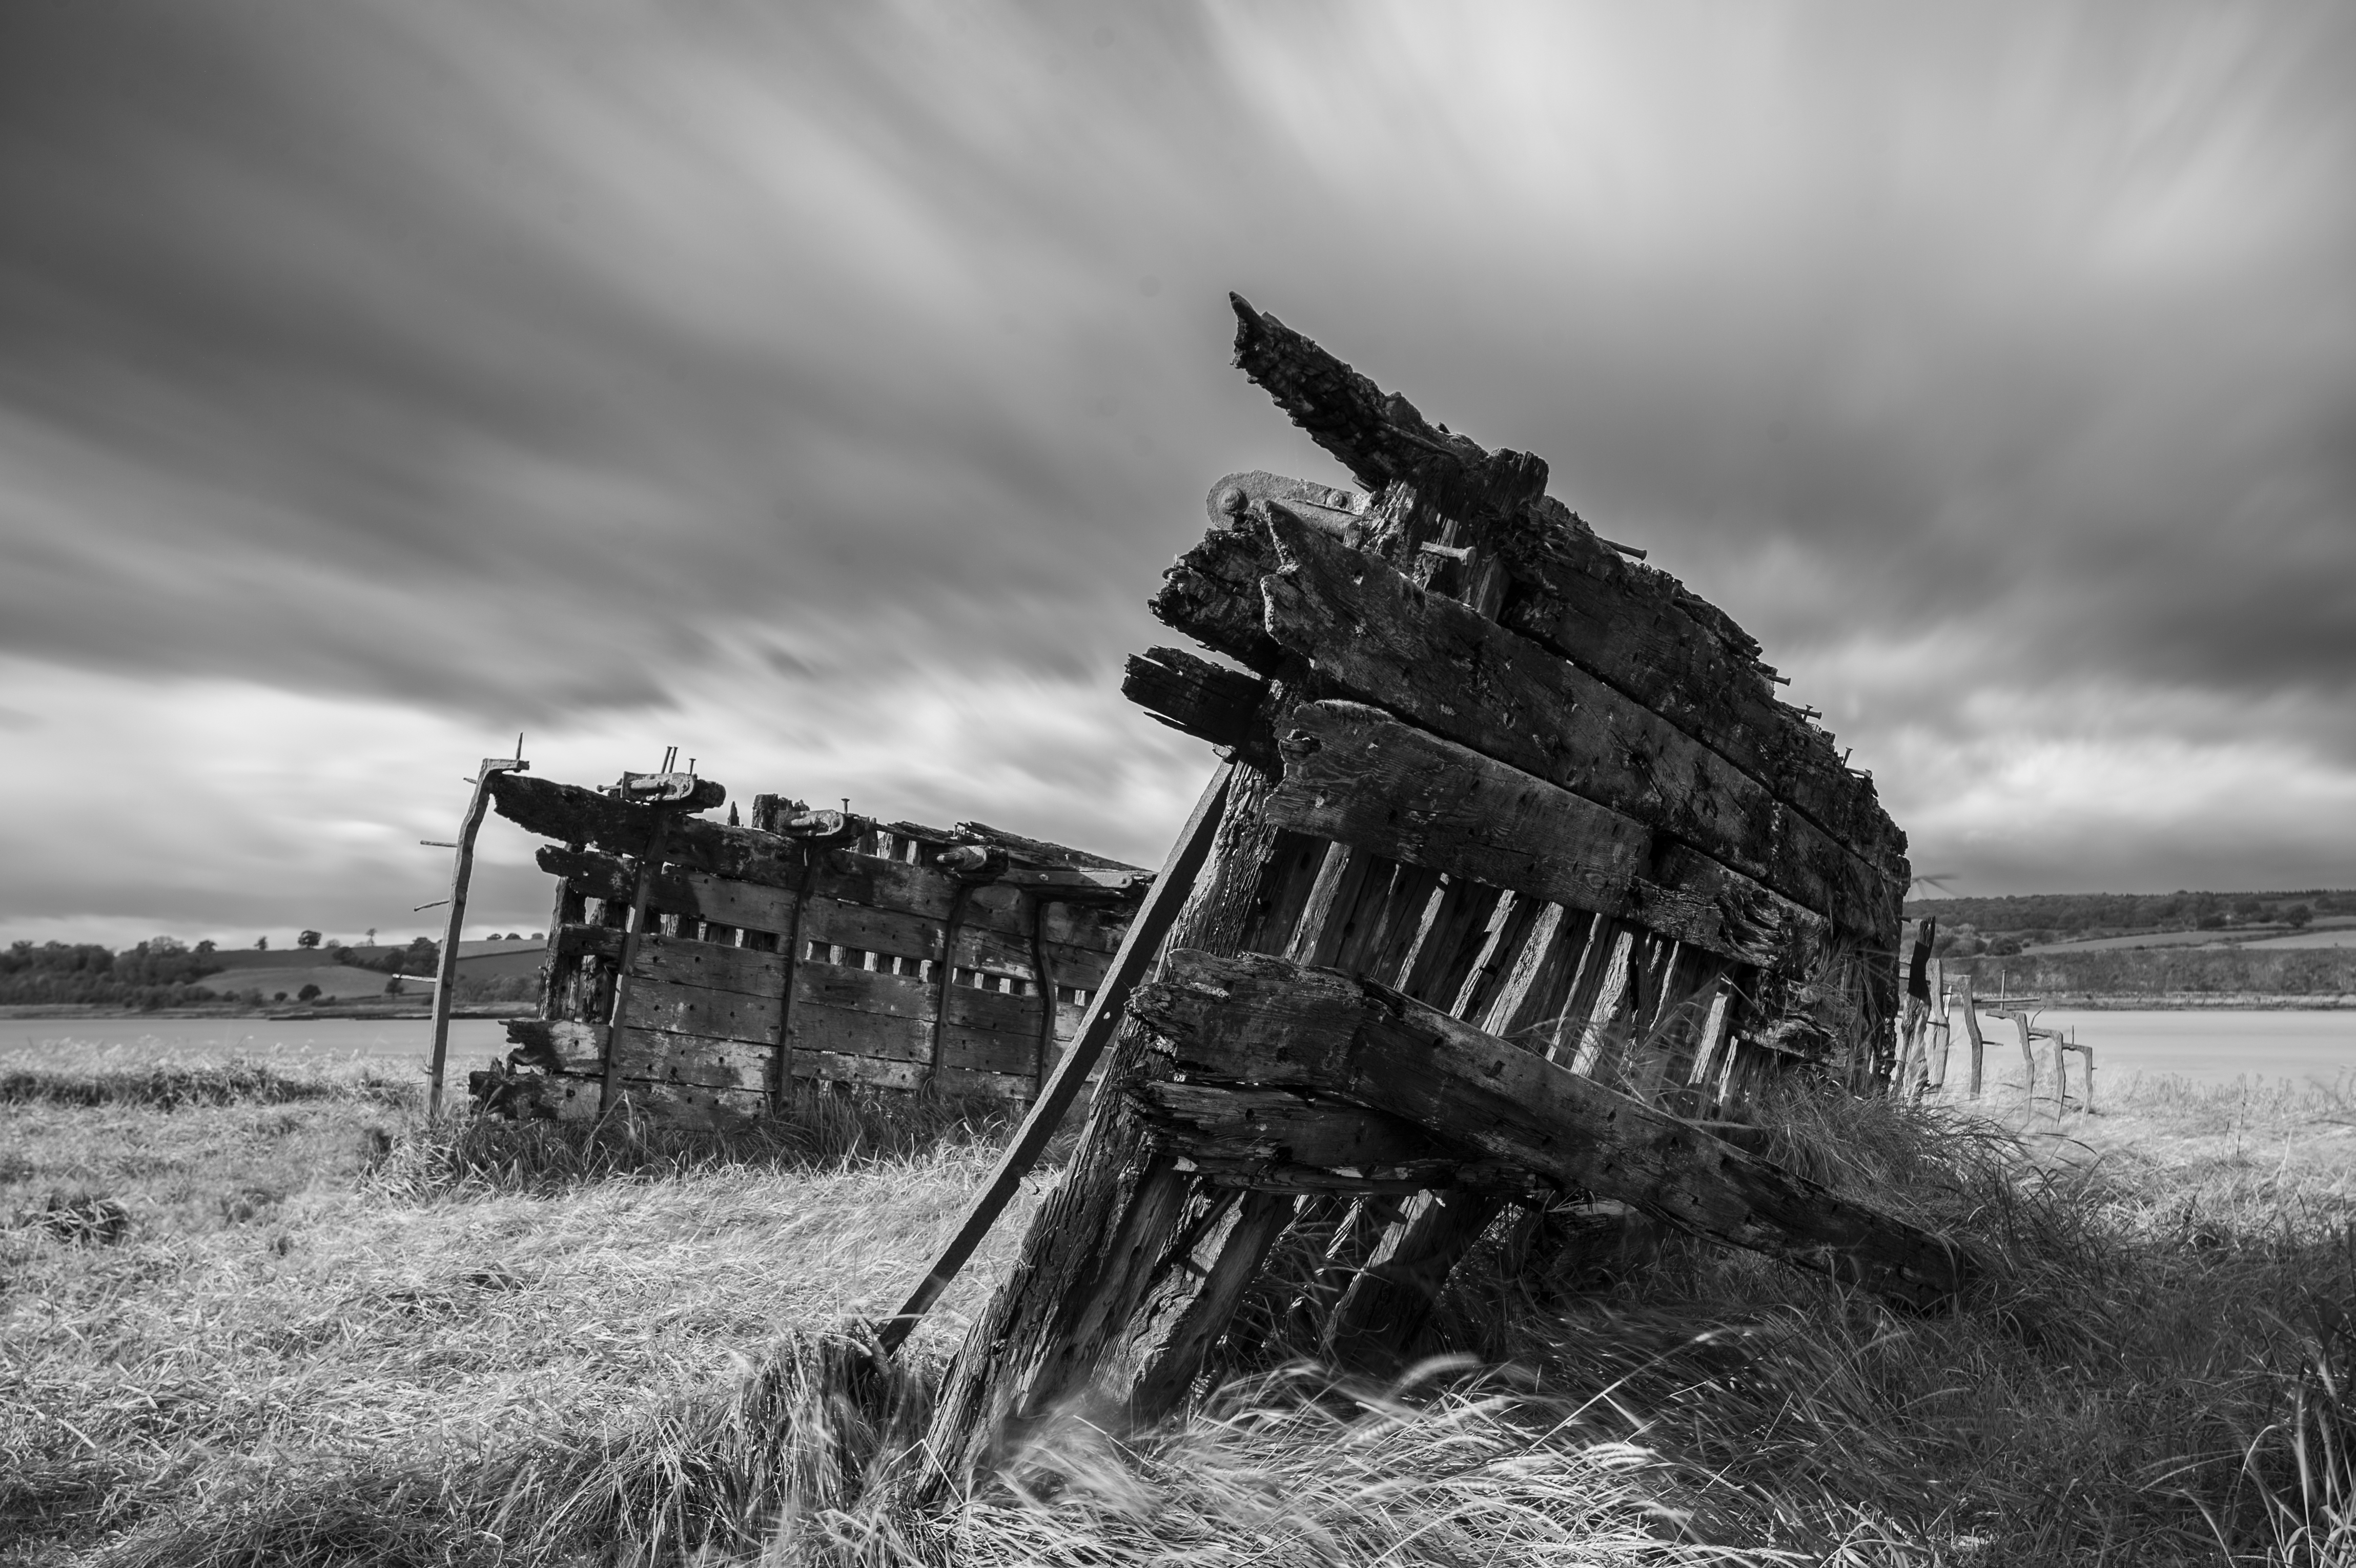
The spectrum of exposure runs from left to right, complete black to complete white. The regions in-between break up into areas of shadow (darker tones), mid-tones (self explanatory) and highlights (lighter tones). The shape of the histogram is determined by the intensity distribution of the whole of the digital image as recorded by the sensor. In the example above the main shape of the histogram is biased toward the mid and shadow tones with lower intensity in the highlights regions. This diagram is from an article and I do not have the original image. However, a similar photograph that I made is shown below.


While they are not the same, there are clearly lots of midtones and shadows in the photograph, with the only major highlights being the lady’s hat and the sky coming into the top right-hand corner.
Going back to the example ‘Summerhouse’, each photograph is essentially the same, so the shape of the histogram distribution doesn’t change much from frame to frame. However, my poor stability in hand-holding the camera means that the intensity distribution of the shadows, mid-tones and highlights would light reflected from subjects in frame are moving. When we look at the colour distributions that are also shown in the histogram, they are also clearly changing in magnitude and position in the tonal spectrum. This is because the light is being reflected into the camera by surfaces that are stronger or weaker in each colour band, e.g. green grass is reflecting strongly in the green region, which is why we see it as green with the human eye.
With regard to the original statement made in the brief ‘you can’t step into the same river twice’, I think this series of photographs demonstrate this clearly. The wind is blowing the trees and around the summerhouse and each frame is clearly different. Add this to each frame being ‘composed’ slightly differently, it is little wonder the the histogram is wandering around.
Second four frames
For the second four frames of this exercise, I set up a simple composition in a fairly dark room with a single continuous LED light source on the subject. The camera was had the same exposure settings as before, with the exception of it being on a tripod. For this exercise, I wanted to eliminate as many potential differences as possible; I’d considered the following:-
- External light changes. The room was darkened but I was unable to make it completely blacked out.
- Composition movement. The tripod would work to reduce this but is was on a carpeted floor, so as long as I kept still during the experiment, it should be fine. I used a remote trigger to eliminate any camera shake through the button being pressed.
- Camera re-focus and re-meter. I eliminated the re-focus by putting the camera in manual focus mode. As the camera is in Program, it will automatically re-meter between frames.
- Camera mirror. The mirror momentarily disturbs the camera as it flips up out of the way. I put the camera into mirror-up mode to reduce this.
The images can be seen below.
-

- Head 1
-

- Head 2
-

- Head 3
-

- Head 4
-
- Head GIF
This set of photographs of a Phrenology Head contain very little colour to distract. When looking at the animation (Head GIF), you can see a very slight variation in the exposure, even though the factors were largely controlled. The exposures were all recorded the same (1/13th at f1.8). The variations in composition are now negligible owing to the tripod and use of the remote shutter release. Nothing is moving in the image itself, which is shown in the animation. The histograms are shown below:
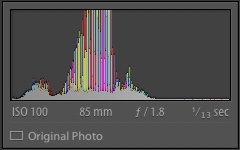
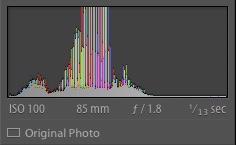
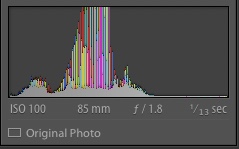
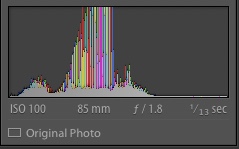
The variations in the histograms are quite clear. A modulation of intensity in the mid-tones that makes sense given the slight fluctuation in the exposures from Head 1 to 4. Also, the image is not monochromatic, so the colours are shown in the histogram. These too are fluctuating across the four images.
Conclusion
I concluded from this exercise that the the camera is indeed a more sensitive measuring device than I had previously believed. Sure, the modern DSLR is a sophisticated piece of electronics and because it is digital, it would be easy to think that the data produced by even the most tightly controlled setup and composition would be the same across a small range of images. It’s production should be a linear process. and as an engineer, I would naturally assume this. However, it is clear to me that there are variables in camera that affect the way the photograph is made before even considering the subject of the composition itself.
Over the past few years, I have been shooting a lot of analogue film as I knew the simplicity of the excellent but predominantly manual equipment available would help me to learn and improve my knowledge of exposure. However, the appeal was also the non-linearity, and often unpredictability of film as a creative medium. Practicing shooting and developing my own film was aimed at improving my skills to a point where that unpredictability could be tamed as much as possible. What I’ve learned from this exercise is that not only is one moment very different from another, digital photography has a level of susceptibility to external influences that I’d not considered before, which ultimately give the photographer that same experience as film.
Research and References:
[1] – “Understanding the Histogram”, Romanas Naryškin, Photography Life 2017. https://photographylife.com/understanding-histograms-in-photography
[2] – “Seeing in Colour: How Our Eyes Sense and Cameras Record”, Dawn Oosterhoff 2015https://photography.tutsplus.com/articles/seeing-in-colour-how-our-eyes-sense-and-cameras-record–cms-24916
